Overall, my formula was fairly accurate, as it made correct predictions in 410 out of 421 non-toss-up races. However, this is less accurate than I would have hoped. Unquestionably, my formula was biased toward Democrats, for a variety of reasons that I will discuss below in my final post of the 2016 election cycle.
Factors within my control:
1. Voters without a college degree - demographic polling throughout the entire cycle showed Democrats performing very well with voters with a college degree compared to previous years. As a result, I added a component to my formula that gave Democrats an advantage in districts where a large proportion of voters had a college education: this led to correct predictions in some of these districts, like FL-07, IL-10, and NJ-05. However, I failed to account for the fact that Republicans were likely to perform well voters without a college degree. This led to incorrect predictions in many such districts, such as CA-10, IA-01, ME-02, MI-01, and NY-22. If I had properly accounted for this shift of non-college-educated voters in my formula, my predictions in these districts would have been more accurate.
2. Hispanic turnout - Hispanic turnout is critical to elections in many House districts across the country, as it is highly variable, and Hispanics tend to disproportionately favor Democrats. Simply put, I estimated Hispanic turnout as higher than it was; this led to incorrect predictions in districts with large Hispanic populations, like CA-10, CA-25, FL-26, and TX-23. One cause of this problem is that I have not yet found a source that provides a good estimate of Hispanic turnout, leading me to estimate Hispanic turnout myself based off of limited data. Over the next year, I hope to find a more reliable source of Hispanic turnout.
Factors outside of my control:
1. Inaccurate generic congressional ballot polling - generic congressional ballot polls are a critical component of my formula, as they normally are a reliable indicator of the country's mood as a whole in regard to Congressional races. Prior to the election, the HuffPost Pollster generic congressional ballot average was Democrats +3.7; however, preliminary results indicate that the actual result was approximately Republicans +2-3, which is an inaccuracy of more than 5 points. Having a generic congressional ballot average that was closer to the actual results would have been enough to shift most of the Tilt Democrat races to Toss-up, which would have removed most of my inaccuraces. I hope that 2018 generic congressional ballot polls are more accurate.
2. Race specific dynamics. Some races have circumstances that cannot be easily quantified into my formula. One of the most common such circumstances is candidates who are corrupt/have a poor public image. Two such examples for this cycle was in FL-26, where Democratic nominee Joe Garcia was widely perceived by many as corrupt/"slimy," and in CA-07, where Democratic Incumbent Ami Bera had a campaign finance incident that hurt his reputation with voters. However, "sliminess"/corruption is not something that can be turned into a number, as far as I know, making it impossible to account for in my formula. Another important circumstance is third party candidates, who can disproportionately take votes from one candidate, causing a skewed result. An example this cycle is in NY-22, where independent Martin Babinec received more than 12% of the vote. However, it is impossible to know for sure whether he took more votes from the Democrat or the Republican. This makes third party candidates also difficult to account for in my formula. Finally, some races simply have an end result that defies all logic in regard to House races. One such race this cycle was MN-02, where every indicator (fundraising, district dynamics, polling, etc.) said that the end result would not even be close, much less end with the Republican winning. I hope to learn the reason why the Republican ultimately won over the next few months.
Conclusion
I would like to thank everyone who read my blog this election cycle. Although our predictions were not as accurate as we would have hoped, I will be striving to improve my formula over the next year so that we can be even more accurate next time. See you in 2018!
Mathematical Predictions for 2016 US House Elections
Monday, November 14, 2016
Monday, November 7, 2016
11/07 Ratings Update - FINAL
Here are my final race ratings for the 2016 House elections. Democrats are projected to pick up between 16 and 30 seats, with an average outcome of 23 pickups. As a result, if Democrats win every race that they are expected to win (Tilt Democrat or better), and they win every Toss-Up, they will win an extremely slim House majority of 218-217. However, this is not a likely scenario, as Toss-Ups are expected to be won approximately equally by both parties. As a result, the most likely result after the elections on Tuesday is a Republican majority of 5-10 seats. Nevertheless, a very slim Democratic majority is within the realm of possibility.
Race Rating Changes:
Updated Race Ratings:
Projected Balance of Power: Currently 247 Republicans, 188 Democrats
D Pickups: 18 Toss-Ups: 10 (0D, 14R) Projected Change: Democrats +23
R Pickups: 2 Range: Democrats +16 - Democrats +30
New Balance of Power: 224 Republicans, 211 Democrats
Range: 217-231 Republicans, 204-218 Democrats
Updated Map:

Race Rating Changes:
| Race | Previous Rating | Updated Rating | |
| CA07 - (Bera) | Safe Democrat |
Likely Democrat
| |
| FL07 - (Mica) | Toss-Up | Tilt Democrat | |
| FL13 - (Jolly) |
Leans Democrat
| Tilt Democrat | |
MD06 - (Delaney)
| Safe Democrat |
Likely Democrat
| |
MI07 - (Walberg)
| Tilt Republican | Toss-Up | |
MN03 - (Paulsen)
| Tilt Republican | Toss-Up | |
| NY01 - (Zeldin) | Tilt Republican |
Leans Republican
| |
NY21 - (Stefanik)
|
Likely Republican
|
Leans Republican
| |
| PA08 - (OPEN) |
Leans Democrat
| Tilt Democrat | |
| TX23 - (Hurd) | Toss-Up | Tilt Democrat | |
| Safe Republican (Republican has >95% chance of winning) | Likely Republican (Republican has 85%-95% chance of winning) | Leans Republican (Republican has 75%-85% chance of winning) | Tilt Repubican (Republican has 65%-75% chance of winning) | Toss-Up (Either side has <65% chance of winning) | Tilt Democrat (Democrat has 65%-75% chance of winning) | Leans Democrat (Democrat has 75%-85% chance of winning) | Likely Democrat (Democrat has 85%-95% chance of winning) | Safe Democrat (Democrat has >95% chance of winning) | |
| FL02 - (OPEN) | AK00 - (Young) | MI08 - (Bishop) | NY24 - (Katko) | CA21 - (Valadao) | CA10 - (Denham) | AZ01 - (OPEN) | CA07 - (Bera) | FL10 - (OPEN) | |
| AZ02 - (McSally) | NC13 - (OPEN) | CA49 - (Issa) | CA25 - (Knight) | CA24 - (OPEN) | MD06 - (Delaney) | VA04 - (OPEN) | |||
| FL17 - (Rooney) | NY01 - (Zeldin) | CO03 - (Tipton) | FL07 - (Mica) | FL26 - (Curbelo) | MN02 - (OPEN) | ||||
| FL18 - (OPEN) | NY02 - (King) | CO06 - (Coffman) | FL13 - (Jolly) | MN08 - (Nolan) | NJ05 - (Garrett) | ||||
| IL12 - (Bost) | NY21 - (Stefanik) |
FL27 - (Ros-Lehtinen)
| IA01 - (Blum) | NV04 - (Hardy) | NY03 - (OPEN) | ||||
| KS03 - (Yoder) | NY23 - (Reed) | IA03 - (Young) | IL10 - (Dold) | ||||||
| MI06 - (Upton) | WI08 - (OPEN) | IN09 - (OPEN) | ME02 - (Poliquin) | ||||||
| MI11 - (Trott) | MI07 - (Walberg) | MI01 - (OPEN) | |||||||
| MT00 - (Zinke) | MN03 - (Paulsen) | NE02 - (Ashford) | |||||||
| NC08 - (Hudson) | NV03 - (OPEN) | NH01 - (Guinta) | |||||||
| NJ04 - (Smith) | NY19 - (OPEN) | NY22 - (OPEN) | |||||||
| NJ07 - (Lance) | PA16 - (OPEN) | PA08 - (OPEN) | |||||||
| NV02 - (Amodei) | VA05 - (OPEN) | TX23 - (Hurd) | |||||||
| OH01 - (Chabot) | VA10 - (Comstock) | ||||||||
| SC05 - (Mulvaney) | |||||||||
| VA02 - (OPEN*) | |||||||||
| All Other Seats Currently Held by Republicans | All Other Seats Currently Held by Democrats |
Projected Balance of Power: Currently 247 Republicans, 188 Democrats
D Pickups: 18 Toss-Ups: 10 (0D, 14R) Projected Change: Democrats +23
R Pickups: 2 Range: Democrats +16 - Democrats +30
New Balance of Power: 224 Republicans, 211 Democrats
Range: 217-231 Republicans, 204-218 Democrats
Updated Map:
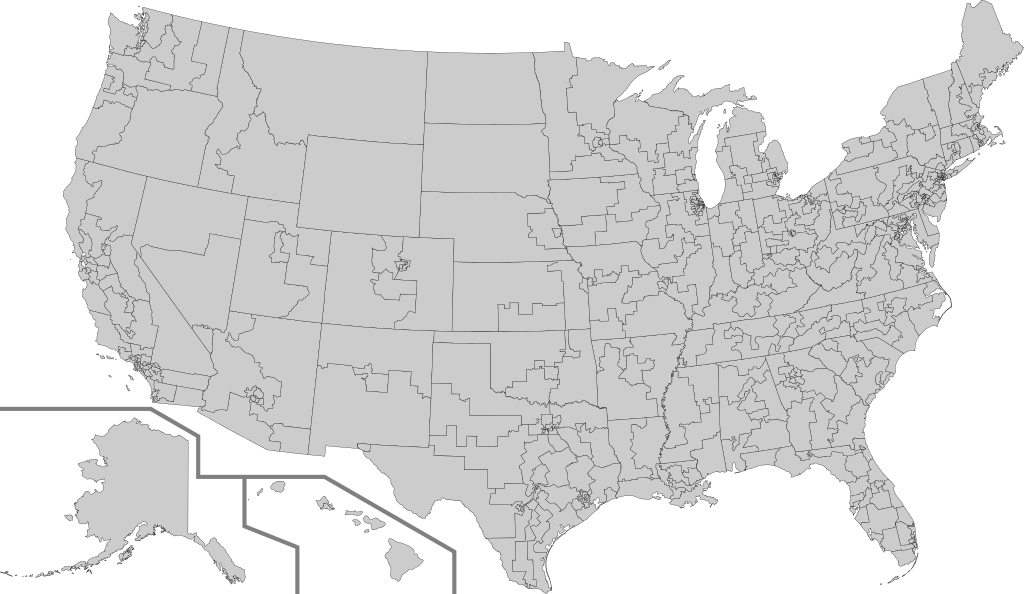
The map that I use is a hexagonal congressional district map, which is a map where every district is the same size geographically, making it possible to see districts in urban areas that cannot be distinguished under a normal congressional district map. I am using this map under a Creative Commons Attribution-ShareAlike 4.0 International license You can read more about it here: http://www.dailykos.com/story/2015/6/3/1389806/-Daily-Kos-Elections-presents-the-best-map-ever-of-United-States-congressional-districts
11/07 Ratings Update - FINAL
Here are my final race ratings for the 2016 House elections. Democrats are projected to pick up between 16 and 30 seats, with an average outcome of 23 pickups. As a result, if Democrats win every race that they are expected to win (Tilt Democrat or better), and they win every Toss-Up, they will win an extremely slim House majority of 218-217. However, this is not a likely scenario, as Toss-Ups are expected to be won approximately equally by both parties. As a result, the most likely result after the elections on Tuesday is a Republican majority of 5-10 seats. Nevertheless, a very slim Democratic majority is within the realm of possibility.
Race Rating Changes:
Updated Race Ratings:
Projected Balance of Power: Currently 247 Republicans, 188 Democrats
D Pickups: 18 Toss-Ups: 10 (0D, 14R) Projected Change: Democrats +23
R Pickups: 2 Range: Democrats +16 - Democrats +30
New Balance of Power: 224 Republicans, 211 Democrats
Range: 217-231 Republicans, 204-218 Democrats
Updated Map:
Race Rating Changes:
| Race | Previous Rating | Updated Rating | |
| CA07 - (Bera) | Safe Democrat |
Likely Democrat
| |
| FL07 - (Mica) | Toss-Up | Tilt Democrat | |
| FL13 - (Jolly) |
Leans Democrat
| Tilt Democrat | |
MD06 - (Delaney)
| Safe Democrat |
Likely Democrat
| |
MI07 - (Walberg)
| Tilt Republican | Toss-Up | |
MN03 - (Paulsen)
| Tilt Republican | Toss-Up | |
| NY01 - (Zeldin) | Tilt Republican |
Leans Republican
| |
NY21 - (Stefanik)
|
Likely Republican
|
Leans Republican
| |
| PA08 - (OPEN) |
Leans Democrat
| Tilt Democrat | |
| TX23 - (Hurd) | Toss-Up | Tilt Democrat | |
| Safe Republican (Republican has >95% chance of winning) | Likely Republican (Republican has 85%-95% chance of winning) | Leans Republican (Republican has 75%-85% chance of winning) | Tilt Repubican (Republican has 65%-75% chance of winning) | Toss-Up (Either side has <65% chance of winning) | Tilt Democrat (Democrat has 65%-75% chance of winning) | Leans Democrat (Democrat has 75%-85% chance of winning) | Likely Democrat (Democrat has 85%-95% chance of winning) | Safe Democrat (Democrat has >95% chance of winning) | |
| FL02 - (OPEN) | AK00 - (Young) | MI08 - (Bishop) | NY24 - (Katko) | CA21 - (Valadao) | CA10 - (Denham) | AZ01 - (OPEN) | CA07 - (Bera) | FL10 - (OPEN) | |
| AZ02 - (McSally) | NC13 - (OPEN) | CA49 - (Issa) | CA25 - (Knight) | CA24 - (OPEN) | MD06 - (Delaney) | VA04 - (OPEN) | |||
| FL17 - (Rooney) | NY01 - (Zeldin) | CO03 - (Tipton) | FL07 - (Mica) | FL26 - (Curbelo) | MN02 - (OPEN) | ||||
| FL18 - (OPEN) | NY02 - (King) | CO06 - (Coffman) | FL13 - (Jolly) | MN08 - (Nolan) | NJ05 - (Garrett) | ||||
| IL12 - (Bost) | NY23 - (Reed) |
FL27 - (Ros-Lehtinen)
| IA01 - (Blum) | NV04 - (Hardy) | NY03 - (OPEN) | ||||
| KS03 - (Yoder) | NY21 - (Stefanik) | IA03 - (Young) | IL10 - (Dold) | ||||||
| MI06 - (Upton) | WI08 - (OPEN) | IN09 - (OPEN) | ME02 - (Poliquin) | ||||||
| MI11 - (Trott) | MI07 - (Walberg) | MI01 - (OPEN) | |||||||
| MT00 - (Zinke) | MN03 - (Paulsen) | NE02 - (Ashford) | |||||||
| NC08 - (Hudson) | NV03 - (OPEN) | NH01 - (Guinta) | |||||||
| NJ04 - (Smith) | NY19 - (OPEN) | NY22 - (OPEN) | |||||||
| NJ07 - (Lance) | PA16 - (OPEN) | PA08 - (OPEN) | |||||||
| NV02 - (Amodei) | VA05 - (OPEN) | TX23 - (Hurd) | |||||||
| OH01 - (Chabot) | VA10 - (Comstock) | ||||||||
| SC05 - (Mulvaney) | |||||||||
| VA02 - (OPEN*) | |||||||||
| All Other Seats Currently Held by Republicans | All Other Seats Currently Held by Democrats |
Projected Balance of Power: Currently 247 Republicans, 188 Democrats
D Pickups: 18 Toss-Ups: 10 (0D, 14R) Projected Change: Democrats +23
R Pickups: 2 Range: Democrats +16 - Democrats +30
New Balance of Power: 224 Republicans, 211 Democrats
Range: 217-231 Republicans, 204-218 Democrats
Updated Map:
The map that I use is a hexagonal congressional district map, which is a map where every district is the same size geographically, making it possible to see districts in urban areas that cannot be distinguished under a normal congressional district map. I am using this map under a Creative Commons Attribution-ShareAlike 4.0 International license You can read more about it here: http://www.dailykos.com/story/2015/6/3/1389806/-Daily-Kos-Elections-presents-the-best-map-ever-of-United-States-congressional-districts
Monday, October 31, 2016
10/31 Ratings Update
Here is my second-to-last ratings update for the 2016 elections. Although the overall projection is similar, with Democrats projected to pick up approximiately 21 seats, the upper end of the range (which is what would happen if Democrats win every seat at Tilt Democrat or better and they win every Toss-up) is Democrats +28 seats. Although this is not an extremely likely scenario, as the toss-ups should split about evenly between both parties most of the time, it is still within the realm of possibility that Democrats could win every toss-up. As a result, if Democrats can move 2 seats from Tilt Republican to Toss-up over the next week, it would move the upper end of the range to Democrats +30, which would be just enough to give them a real, although unlikely, chance at retaking the House.
Race Rating Changes:
Updated Race Ratings:
Projected Balance of Power: Currently 247 Republicans, 188 Democrats
D Pickups: 16 Toss-Ups: 10 (0D, 14R) Projected Change: Democrats +21
R Pickups: 2 Range: Democrats +14 - Democrats +28
New Balance of Power: 226 Republicans, 209 Democrats
Range: 219-233 Republicans, 202-216 Democrats
Updated Map:

Race Rating Changes:
| Race | Previous Rating | Updated Rating | |
| AZ02 - (McSally) |
Leans Republican
|
Likely Republican
| |
CA10 - (Denham)
| Toss-Up | Tilt Democrat | |
| CA24 - (OPEN) |
Likely Democrat
|
Leans Democrat
| |
| CA25 - (Knight) | Toss-Up | Tilt Democrat | |
| FL18 - (OPEN) |
Leans Republican
|
Likely Republican
| |
| MI01 - (OPEN) |
Leans Democrat
| Tilt Democrat | |
MI07 - (Walberg)
|
Leans Republican
| Tilt Republican | |
| MI08 - (Bishop) |
Likely Republican
|
Leans Republican
| |
| MN02 - (OPEN) | Safe Democrat |
Likely Democrat
| |
| MT00 - (Zinke) |
Safe Republican
|
Likely Republican
| |
| NC08 - (Hudson) |
Safe Republican
|
Likely Republican
| |
NE02 - (Ashford)
|
Leans Democrat
| Tilt Democrat | |
NJ02 - (LoBiondo)
|
Likely Republican
|
Safe Republican
| |
| NV03 - (OPEN) | Tilt Democrat | Toss-Up | |
NY21 - (Stefanik)
|
Leans Republican
|
Likely Republican
| |
| NY22 - (OPEN) |
Leans Democrat
| Tilt Democrat | |
| VA02 - (OPEN*) |
Leans Republican
|
Likely Republican
| |
| WI08 - (OPEN) | Tilt Republican |
Leans Republican
| |
| Safe Republican (Republican has >95% chance of winning) | Likely Republican (Republican has 85%-95% chance of winning) | Leans Republican (Republican has 75%-85% chance of winning) | Tilt Repubican (Republican has 65%-75% chance of winning) | Toss-Up (Either side has <65% chance of winning) | Tilt Democrat (Democrat has 65%-75% chance of winning) | Leans Democrat (Democrat has 75%-85% chance of winning) | Likely Democrat (Democrat has 85%-95% chance of winning) | Safe Democrat (Democrat has >95% chance of winning) | |
| FL02 - (OPEN) | AK00 - (Young) | MI08 - (Bishop) | MI07 - (Walberg) | CA21 - (Valadao) | CA10 - (Denham) | AZ01 - (OPEN) | MN02 - (OPEN) | FL10 - (OPEN) | |
| AZ02 - (McSally) | NC13 - (OPEN) | MN03 - (Paulsen) | CA49 - (Issa) | CA25 - (Knight) | CA24 - (OPEN) | NJ05 - (Garrett) | VA04 - (OPEN) | ||
| FL17 - (Rooney) | NY02 - (King) | NY01 - (Zeldin) | CO03 - (Tipton) | IA01 - (Blum) | FL13 - (Jolly) | NY03 - (OPEN) | |||
| FL18 - (OPEN) | NY23 - (Reed) | NY24 - (Katko) | CO06 - (Coffman) | IL10 - (Dold) | FL26 - (Curbelo) | ||||
| IL12 - (Bost) | WI08 - (OPEN) | FL07 - (Mica) | ME02 - (Poliquin) | MN08 - (Nolan) | |||||
| KS03 - (Yoder) |
FL27 - (Ros-Lehtinen)
| MI01 - (OPEN) | NV04 - (Hardy) | ||||||
| MI06 - (Upton) | IA03 - (Young) | NE02 - (Ashford) | PA08 - (OPEN) | ||||||
| MI11 - (Trott) | IN09 - (OPEN) | NH01 - (Guinta) | |||||||
| MT00 - (Zinke) | NV03 - (OPEN) | NY22 - (OPEN) | |||||||
| NC08 - (Hudson) | NY19 - (OPEN) | ||||||||
| NJ04 - (Smith) | PA16 - (OPEN) | ||||||||
| NJ07 - (Lance) | TX23 - (Hurd) | ||||||||
| NV02 - (Amodei) | VA05 - (OPEN) | ||||||||
| NY21 - (Stefanik) | VA10 - (Comstock) | ||||||||
| OH01 - (Chabot) | |||||||||
| SC05 - (Mulvaney) | |||||||||
| VA02 - (OPEN*) | |||||||||
| All Other Seats Currently Held by Republicans | All Other Seats Currently Held by Democrats |
Projected Balance of Power: Currently 247 Republicans, 188 Democrats
D Pickups: 16 Toss-Ups: 10 (0D, 14R) Projected Change: Democrats +21
R Pickups: 2 Range: Democrats +14 - Democrats +28
New Balance of Power: 226 Republicans, 209 Democrats
Range: 219-233 Republicans, 202-216 Democrats
Updated Map:
The map that I use is a hexagonal congressional district map, which is a map where every district is the same size geographically, making it possible to see districts in urban areas that cannot be distinguished under a normal congressional district map. I am using this map under a Creative Commons Attribution-ShareAlike 4.0 International license You can read more about it here: http://www.dailykos.com/story/2015/6/3/1389806/-Daily-Kos-Elections-presents-the-best-map-ever-of-United-States-congressional-districts
Subscribe to:
Posts (Atom)